

Use Google Analytics to track site visitors
To keep visitors converting to leads, sales, and even re-visits, you need to know how to monitor the best Website Traffic Sources. There are several ways to do this and analyze their behavior on your website, but in this article, we are going to focus on the simplest and most in-depth platform in this field: Google Analytics. And more importantly, this service is completely free!
What is Google Analytics?
Google Analytics is a free service from Google that provides accurate statistics about your website visitors and traffic source, while also monitoring measurable data such as website conversion and sales. . Webmasters can examine this data to determine which traffic sources, search engines, advertising resources, or resources to get the most and highest quality traffic to the website. This program is the most advanced and practical web analysis program available to website owners.
Why should we use Google Analytics?
This information is very valuable and all website owners should use this program because the information obtained by this program allows you to monitor the behavior of your audience. Other common reasons why you should use Google Analytics right now include:
Google Analytics lets you get to know your audience better.
Each person who enters your website is different. They have different intentions, and Google Analytics allows you to analyze their behavior. This information allows you to modify your website to provide a better user experience for those people.
Understand where valuable visitors come from
Knowing where your visitors come from is as important as knowing who they are. Google Analytics lets you take an in-depth look at the source of your website traffic and visitor traffic. Traffic sources are considered “were to come from” things like search engines, other websites, or advertising sources. The flow of visitors also determines their “how” such as information such as the keywords used to find your website and the type of device used to navigate your website. (Note: Is your conversion rate for targeted mobile traffic devices less than desktop visitors? This is a good sign that the user experience with your mobile needs to be polished, so it is better to provide a pleasant user experience Work more for mobile users, you can solve this problem by installing a mobile optimization plugin.
Find out what visitors do as long as they are on your website
Suppose you could figure out what visitors are doing to your site, what pages they are viewing, and who is leaving the site. The good news is that Google Analytics does this for you to some extent. This app allows you to have an in-depth look at the steps a visitor goes through on your website, from the time they enter the website to the time they leave. This information can help you understand which pages and content lead to the most conversions and which ones will get customers back to your website. A “bounce” is when a visitor visits your website and leaves without looking at another page. Google Analytics also has live reporting, allowing you to keep a close eye on website traffic.
A 3-step guide to using Google Analytics
Step 1: Set up and install Google Analytics
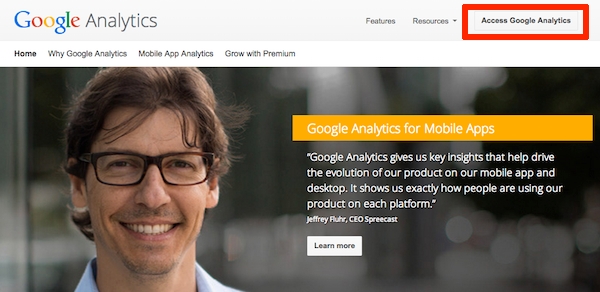
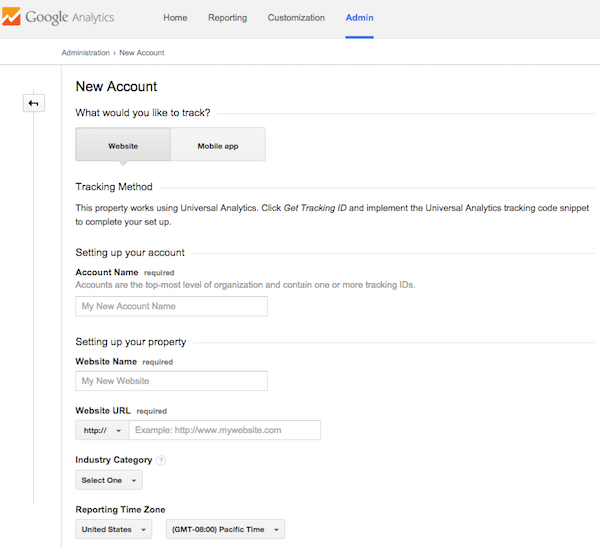
When you first enter the Google Analytics registration page, if you do not have a Google Account, you will be asked to create an account. If it uses Gmail, you can use Gmail user information to create a Google Analytics account. Setting up an account is relatively easy. By default, the “Website” section is selected under “What account would you like to track”. You need to define a name for your account and then enter the name of the website address next to it. After selecting this and the time zone in which you live, you can click on the “Get Tracking ID” button to create a special code for Google Analytics.
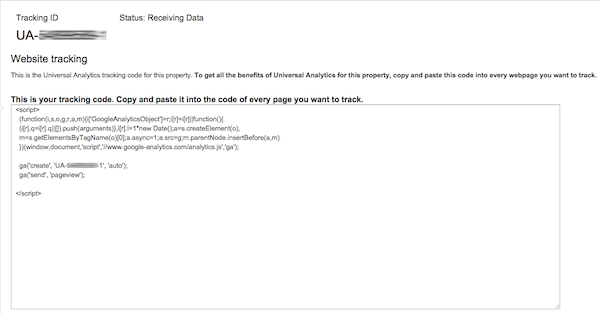
Once you have completed the registration process, you can access your own ID, as shown in the figure below:
Now if your website is based on the WordPress CMS platform, you can use this ID with just a few clicks on your entire website.
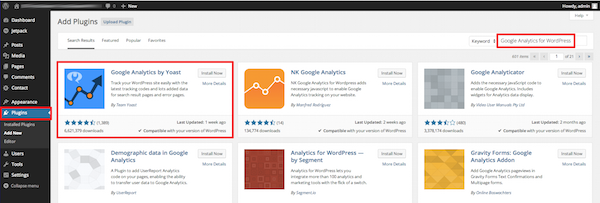
Then in the admin section, log in to WordPress and click on the “Plugins” menu on the left side of the user dashboard. Search for “Google Analytics for WordPress” in the search bar at the top right. Select the first option, as shown below, “Google Analytics by Yoast”, which is the best plugin for ID monitoring. Click Install Now and install the plugin.
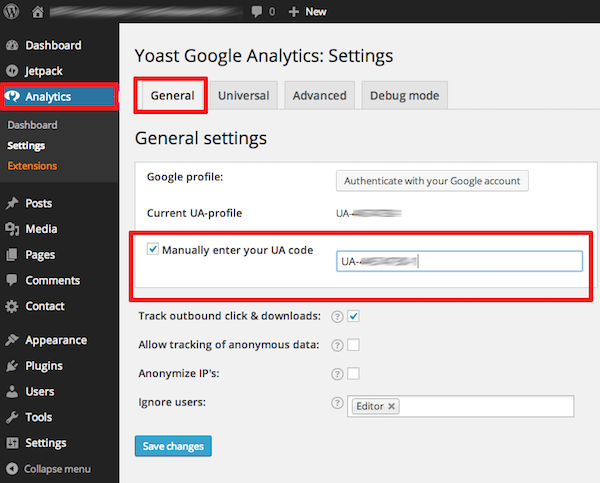
After installing the new plugin, click on the “Analytics” bar in the WordPress dashboard and reach the General light. Check the option to manually enter your UA code and enter your ID where it is UA and then the number. Also, be sure to check the box below to enable outbound clicks and downloads as shown below, and then click OK to allow the connection between your plugin and your Google Analytics account. After finishing the work, be sure to click the Save Changes option to finish the work.
After doing this, all you have to do is log in to your Google Analytics account and make sure the code is installed correctly. Go back to the part of the page where you received the tracking ID and make sure the status is “Receiving Data”. Your account has been set up and Google is receiving information from your website. You can now enter the second stage of work.
Step 2: Set your goals and monitor conversions
Only by installing a tracking ID as described in the first step can you monitor the number of visits to your website every day and find out where visitors come from, what they do when they are on your website, and how many Your website is left. While this may sound like a lot, you also want to know how many of them did what you had in mind when they were on your website. Things like downloading e-books, registering for information, newsletters, or shopping. You can do all this with Google Analytics.
When it comes to customer conversion, every website has different goals in this regard. Some websites aim to collect leads while others want to turn visitors into buyers. The first step is to define your goals. Your goals are the reason for your website. Some websites have only one goal, but others have step-by-step goals that lead to their main goal.
A blog that publishes articles that have relevant and relevant links aims to increase its leadership so that they can extend their subscriber list themselves. They probably define their goal as email registration on the site. A website that sells digital download products will have another purpose in addition to sales. They probably want to collect leads to continue marketing for those who go to their website without making a purchase after the first visit.
Spatial goals
The easiest goal is to create a URL spatial goal, which is the way most websites use to track sales, signups, and subscriptions. When a visitor completes a purchase on a website, they are usually redirected to a thank you page, and this URL is probably what you want to track because it approves the purchase. The same concept applies to digital downloads or newsletter subscriptions. The URL sent to the visitor will always be the target.
How to Create a Target URL Location
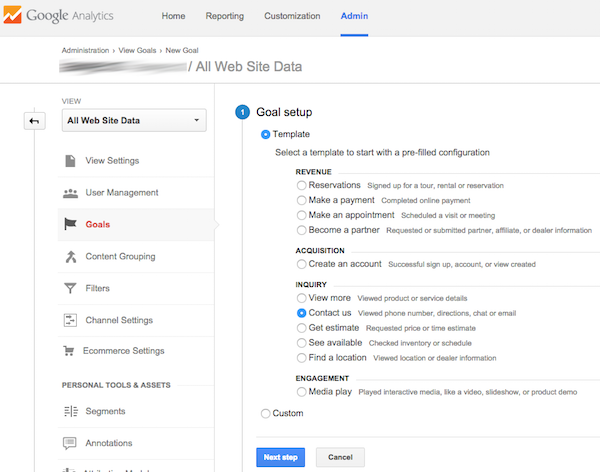
You must first fill in the URL of the thank you page you are about to send to the visitor. In the Google Analytics dashboard you have to go this route:
Admin> Goals> New Goal
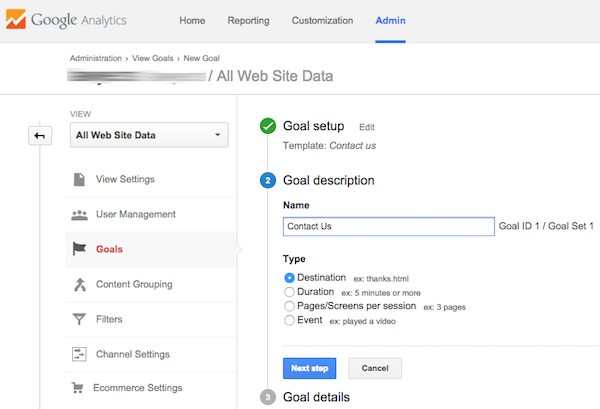
You will now see several options such as Revenue, Acquisition, Inquiry, Engagement, or Custom. You need to choose the option that best suits your purpose. For example, suppose your goal is to monitor which visitors fill out the “Contact Us” form.
Once you have selected the correct target, click on “Next Step” to complete the description of the target. Then you have to define a name for it, but for the sake of simplicity, we call this goal “Contact Us”. You also have to select the type, and for example, we have to select the “Destination” type because we want to use the thank you page as the confirmation URL for our conversion purpose.
Clicking Next Next again will take you to the goal details section. You must enter the desired URL here. If your goal is to create a goal to buy a particular product, you can assume a monetary value for that goal. If you are using paid traffic this will be very effective because you can find out if your campaign is profitable or not. When you are done, click Create Gaol to get this goal started.
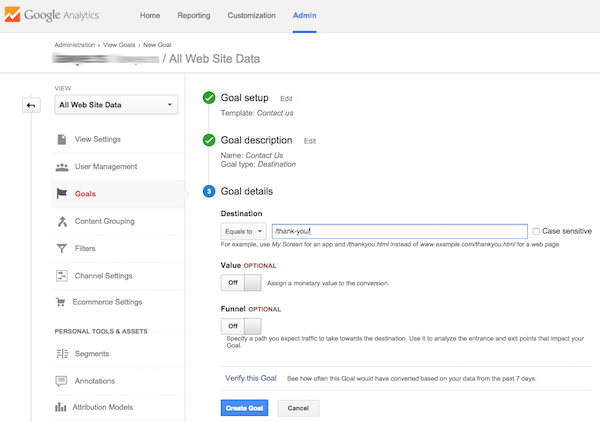
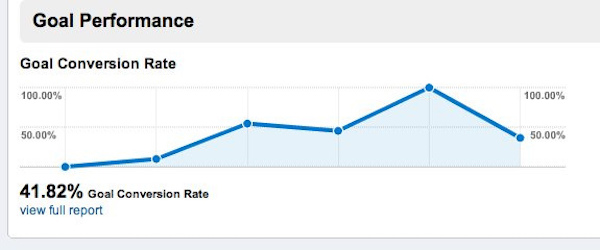
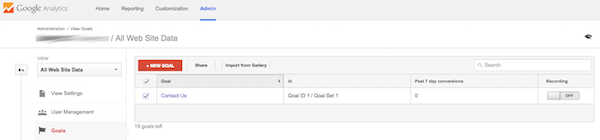
Once you have successfully set up each of the goals, be sure to try them out several times to make sure the program is properly recording and tracking your goals. By default, the program shows the conversion rate in the last 7 days. You can define up to 20 goals in your account.
Monitoring goals
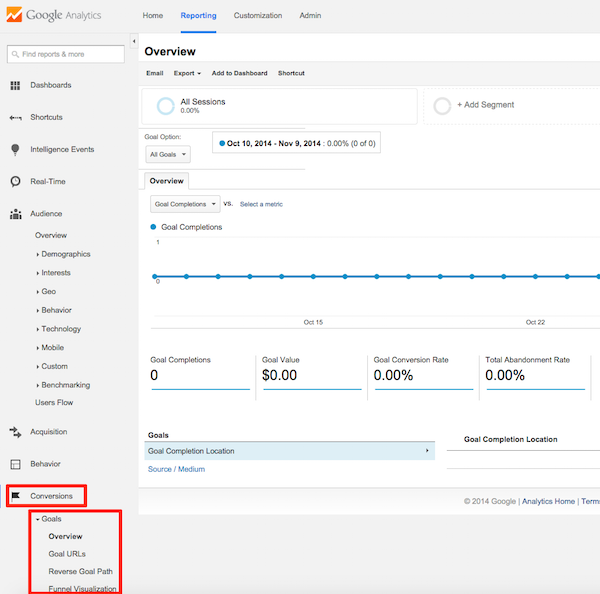
Once you have all your goals set and set up properly you need to know how to monitor them. You can check their status from the following address:
Conversions> Goals
This information shows you the number of occurrences of each of your goals in the specific time periods you have selected. Examining this data allows you to determine which traffic sources have the most conversions for each goal, so you can change your traffic-generating strategies to lead to more conversions. Take the time to set your goals because they are one of the most important aspects of your website. We come to step 3 to look at how to analyze the interactions on your website.
Step 3: Analyze the interactions made on the website
While the goals we outlined in step 2 are very helpful, they are only a small part of the benefits that Google Analytics has for you. Knowing your website bounce rate, which geographies generate the most and best traffic, and which content is most popular on your website, all of which will improve your website and bring you closer to your goals.
What is the Bounce Rate?
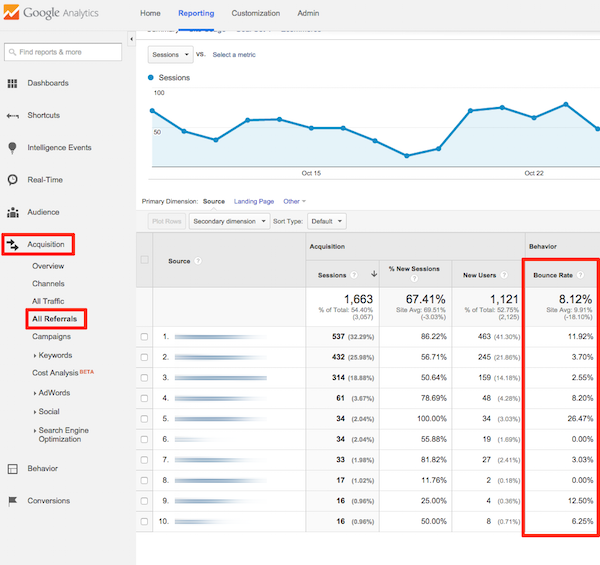
Bounce rate refers to the number of visitors who leave the site without engaging in any of your website content. A high bounce rate usually indicates that your visitors are not interested in what you are offering on your website or that it has been difficult for them to navigate your website. Low bounce rates should always be your goal, so you need to know which traffic sources generate the most visitors who are interested in your offer and want to stay on your website.
In the Google Analytics dashboard, select the “Acquisition” bar and then “ALL Referral”. It shows you all the reference traffic and you can see the bounce rate of each of them. In the example below, you can see that the bounce rate along the chart is very good but it can always be improved so we have to look at a traffic source that has a 26% bounce rate and see if we can get a better user experience from it. Whether to provide the source or not.
If the source of paid traffic has a very high bounce rate, it is best to shift the costs you spend there to areas that generate better traffic and visitors become leads there, or sign up and buy. they do. If the bounce rate is high across the chart, it probably indicates that your website homepage needs to be more engaging and provide a better user interface.
What is a good bounce rate on a website?
Naturally, you are curious about what a good bounce rate means, but it is difficult to answer this question with numbers. Most websites are in the range of 25 to 60% and websites with low content have a higher bounce rate. Instead of answering with numbers here, we say that a good bounce rate means the bounce rate of a site decreases each month to below 10%. If you are constantly improving your website usage, the bounce rate from your site will probably decrease over time.
How do you know which country your readers are from?
To find out where your website traffic comes from, just click on “Audience” in the Google Analytics dashboard, then select Geo targeted website traffic and then Location. Here you can see the countries your visitors come from. You can then view each person based on their country and bounce rate, the number of pages they viewed per visit, and the average amount of time people from each country spent on your website.
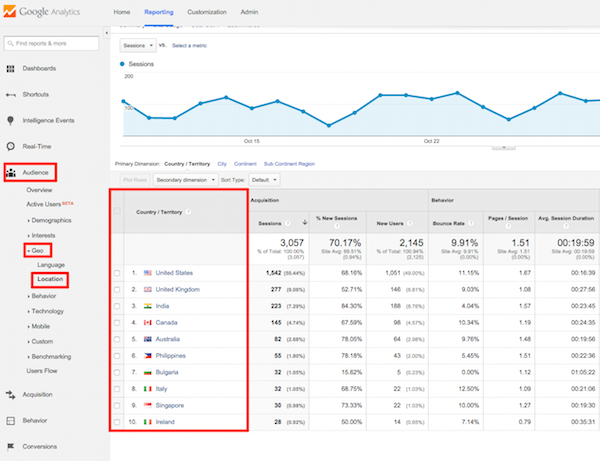
Looking at the example below, you can see that more than half of the real human website traffic comes from the United States and less than one percent of the visitors are from Ireland. This type of information helps you understand which countries are interested in your offers and allows you to tailor your marketing efforts in the future to target audiences that have been more active on your website.
How do we know which of your articles is the most popular?
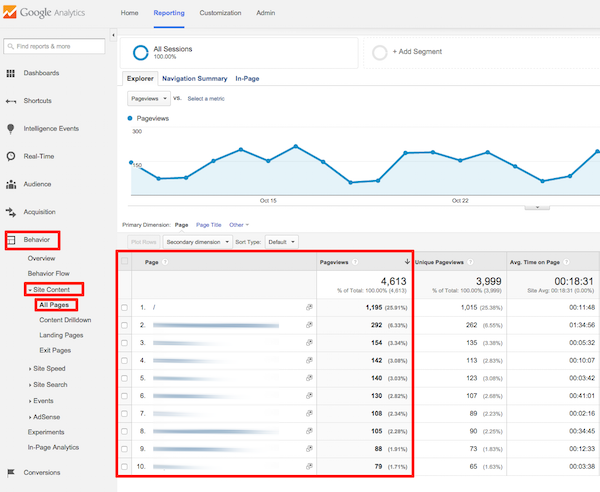
Knowing which content on the website gets the most traffic is a great way to identify the topics and types of content that your audience gets the best feedback on. On the Google Analytics page, click on the “Behavior” bar, then select “Site Content” and then “All Pages” to see the most popular pages on your website. Naturally, as the image below shows, the home page will be the most popular page. Use this information to identify better blog content and topics in the future. For example, if you find that your educational content and listings have attracted more attention, try to make the rest of the content the same way.
What is the difference between Entrance, Session, and Page View?
When a visitor enters your website for the first time, their movement is recorded as Entrance or login to the site, and thus you can easily consider this criterion as the first visit of the page in the first visit of the site. It does not matter what other pages the visitor browses, no other entries will be registered in this visit. Pageviews are recorded each time a visitor visits another page on the website, and this number increases as long as they are present on the website. The session is also recorded on the first page of each visit.
Suppose a visitor enters your website and sees only two pages and exits the website. His visit is as follows:
Logged in to Website> Page 1> Page 2> Exit Website
The data recorded in Analytics are as follows:
- Page 1: 1 login, 1 attendance period, 1-page visit
- Page 2: 0 login, 0 attendance period: 1 page visit
Conclusion
This is how you first learned to work with Google Analytics. when you buy website traffic you can Use the information we have prepared for you to register with Google Analytics and install it on your website and take advantage of it. Knowing where your visitors come from and what they do will help you build a successful website. A page may not be interesting to visitors and have a high bounce rate, but you will never realize this without using Google Analytics. Gathering this type of information is a lot and launching Google Analytics should be one of your priorities.


